MDesign
The MDesign software helps operators, service providers and regulators to evaluate and optimize different sensor networks in order to maximize their cost-effectiveness.
![]() The performance of an existing network can also be assessed and compared to results from recorded data. It is capable of using a full 3D model to provide the best possible analysis.
The performance of an existing network can also be assessed and compared to results from recorded data. It is capable of using a full 3D model to provide the best possible analysis.
MDesign is applicable for both simple and complex monitoring scenarios: single or multi-well downhole networks, surface arrays, ocean bottom networks, or any combination of these.
The purpose of MDesign is performance evaluation of a proposed design. The effectiveness of a seismic network can thus be compared for different:
- Sensor distributions (short vs long string, single or multi well, downhole vs surface vs hybrid)
- Velocity models (1D or 3D)
- Noise levels (uniform or variable for each sensor)
- Sensor failure simulations (redundancy testing)
To determine the optimal sensor layout for a seismic monitoring campaign, MDesign aims to answer the following questions, important during network design:
- How cost-effective are different sensor layouts?
- What is the detection limit of a given network?
- How good are the event locations?
- Are regulatory requirements met by a given network?
NORSAR also offers network design as a service, using our in-house expertise based on our well established network design and seismic monitoring experience.
MDesign is available as the latest NORSAR software package in the new NORSAR Software Suite framework.
Detectability
MDesign’s detectability analysis allows the user to find the minimum magnitude that can be 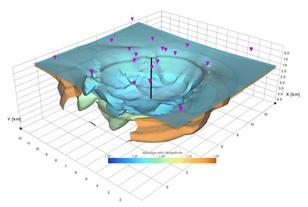 detected for a given seismic network, throughout a model region. Multiple workflows can be created and tested for different sensor configurations. Different noise models can be generated, sensor failure can be simulated, and the effect of different input velocity models can be assessed.
For each network setup, parameters can be set for:
- Number of required sensors to be ‘triggered’
- Noise level at each sensor
- Attenuation
A 3D volume of detectability is generated that can be viewed interactively via cross-sections or isosurfaces of detectability. By analyzing maps of detectability the user can identify the network design to best meet the project goals. The detectability can also be evaluated to determine if regulatory requirements can be met. Furthermore, sensor failure and their impact on event detection can be quickly simulated.
 Location uncertainty
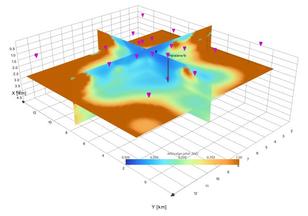
MDesign’s location uncertainty analysis shows the variability of location precision throughout a model region. The location uncertainty is calculated for a specified event magnitude, where the detectability of the event at each sensor is considered during the computation. Similar to MDesign’s detectability analysis, multiple workflows can be created and tested for different sensor configurations, noise levels and velocity models.
The expected location uncertainty for various scenarios can be evaluated by its dependence on various parameters:
- Noise level (and SNR) at each sensor
- Errors for arrival-time picks & ray angles
- Event magnitude (i.e. triggered sensors)
The location uncertainty can be analysed via different components of uncertainty:
- Total (RMS) uncertainty
- Individual uncertainty directions (N, E, Z, minor, intermediate, major)
- “Ellipticity” (to evaluate uncertainty uniformity)
To increase understanding of the results and further improve a sensor network, MDesign allows for quick ray path analysis for all event locations through the complex model.
Focusing
MDesign’s focusing analysis shows the resolution for migration based location methodologies - typically used for dense surface arrays and ocean bottom networks. The focusing of seismic 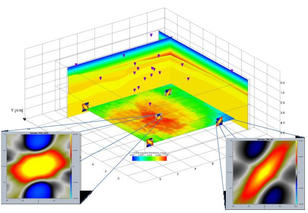 energy at a given location can be determined using Point Spread Functions, which incorporate the network layout, the velocity model, and the shape and frequency of a source wavelet, to compute the imaging response. By generating Point Spread Functions throughout a model region, the effectiveness of a given sensor configuration can be evaluated. This analysis allows the user to optimise a sensor layout by ensuring, sensor count, sensor spacing, line length and line spacing are all sufficient for a given target region.
For each network setup, parameters can be set for the source wavelet (frequency and shape), using predefined or user input functions. The spatial sampling of the Point Spread Functions can also be varied.
The resulting 3D volume of ‘focusing’ can be explored via cross-sections and with interactive ray-path plotting.