Illumination Maps
Are the targets well illuminated? Are there shadow zones? How large migration aperture is required? How long streamers are required?
Illumination maps show how well a target horizon is illuminated by a survey. The basic map is the hit map, which shows for a survey how many rays from shots to receivers reflect on the different parts of the horizon. Shadow zones clearly stand out on hit maps. There are more maps; they show different parameters computed along the rays, including: Travel time, reflection angle, required migration aperture, and amplitude. The maps are divided into grid cells, and for each parameter the maps show how minimum, maximum, and average value of the parameters vary across the horizon. A map can be restricted to a certain interval of another parameter. For example, separate maps can be made for different offset intervals, to show which offsets are important in a survey. Most commonly, the illumination information is put down on the target, but similar maps can also be made with the information posted in the shot or receiver locations. These maps show which shot and receiver positions contribute most to the illumination, and the maps may reveal that shots or receivers may be skipped in some areas.
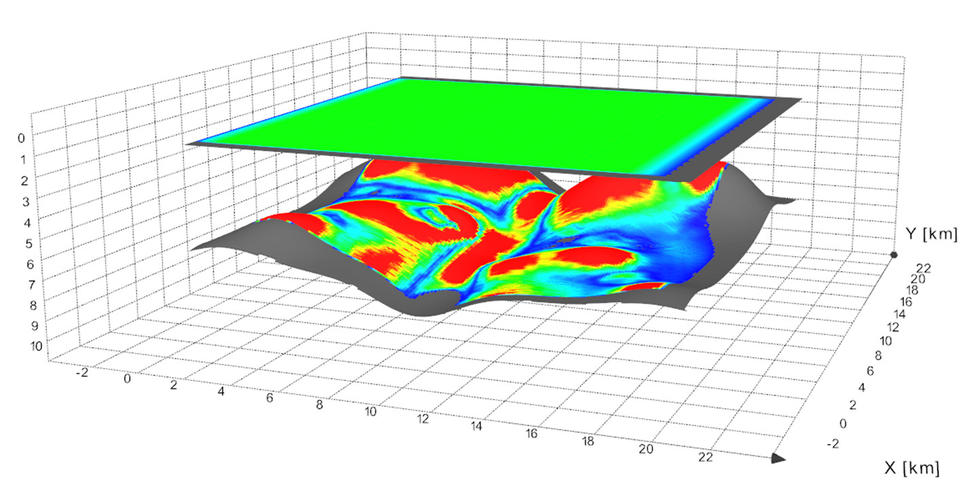
Comparison of the nominal fold, here shown on the surface, and the expected fold at the target, computed as a hit map.
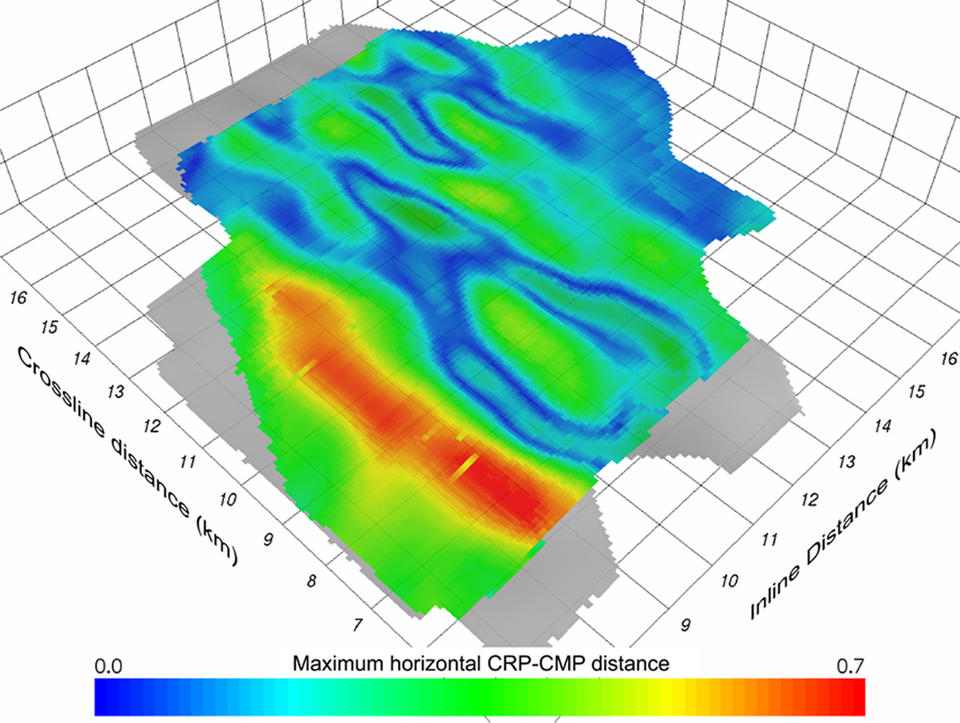
Illumination map showing maximum horizontal difference between common reflection point (CRP) and common midpoint (CMP). This is the required migration aperture if all reflections are to be depth migrated.